Measuring and Mitigating Model Bias
Recent advances in Artificial Intelligence (AI) have great promise, but there has also been significant concern about their potential unequal treatment for people from historically marginalized backgrounds (see this recent White House Executive Order). In education, improving the outcomes for students from marginalized backgrounds is a key objective. Recent studies using Large Language Models like ChatGPT have also shown higher error rates for non-native English writers and cultural values that misrepresent people from non-English-speaking countries, which characterizes bias against a growing share of the US student population. In the research community, there have been long-standing discussions about how to measure and limit bias in AI models (for reviews, see here and here).
Learning engineers use a wide range of data-driven models for AI and machine learning (ML) applications to support or automate decisions and provide feedback. In pursuit of a common goal like doubling math achievement in low-income middle schools, innovative education platforms will develop and integrate dozens of models, for example, models for student engagement, teacher feedback, tracking learning over time, and student feedback on assignments. In this context, bias is generally defined as systematically inaccurate results toward specific groups of students based on an underlying characteristic, such as their racial/ethnic identity, socioeconomic status, or other factors. While educational outcomes vary systematically between groups of students defined by these characteristics, there is a risk that AI models make less accurate predictions for more underrepresented or marginalized groups of students, and thereby exacerbate current inequalities.
Ensuring that learned models do not introduce or amplify systematic biases against underrepresented or historically marginalized groups is critical. Models are trained on datasets collected in many different contexts, which frequently differ from the one where the model will be deployed. Bias mitigation is generally defined as an intervention at one or more points in the process of creating and deploying a model to remove undesirable, systematic variation in model predictions. We address this topic here by providing (1) a simple metric for measuring bias, (2) an overview of bias mitigation strategies, (3) an overview of bias analysis and mitigation toolkits, and (4) a quick demonstration of how to measure and mitigate bias with the help of a toolkit. There are many important questions that remain the subject of active research and many decisions in this space are context dependent, such as which fairness measure and bias mitigation strategy to use. We hope this guide serves a primer and as a starting point for more contextualized examinations of bias and fairness.
Measuring Bias
We recommend starting with a versatile and easy-to-compute measure of model bias to create a common benchmark and an analytical basis for sharing what mitigation strategies have worked. This measure is based on the Area Under the Receiver Operating Characteristic Curve (AUC). AUC is commonly used to assess the ability of a trained classifier to accurately distinguish between classes based on information about the correct (true) class. AUC scores are constrained to [0, 1], with a random predictor achieving an AUC of 0.5.
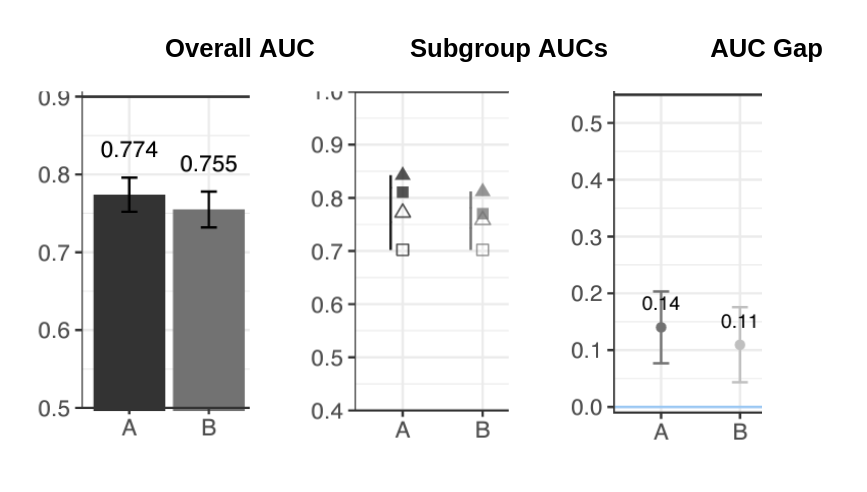
To measure bias in classification models, we encourage engineers to consider using AUC Gap: the absolute difference between the highest and lowest AUC for subgroups (e.g., gender, race, SES, prior knowledge) in the test set. Classification models are typically used to determine whether an intervention should be employed, and this measure captures the worst-case performance gap in the model between a set of subpopulations. AUC Gap quantifies the largest disparity in predictive performance over subgroups and can be visualized along with AUC to add context to model results, as shown in Figure 1. It is agnostic to the algorithm used and it captures the disparity in model performance for any number of subgroups, which enables non-binary bias assessments such as for intersectional identity groups.
AUC Gap assumes that the goal is to make the most accurate predictions for all subgroups, and thus, that fairness is achieved when all subgroups have equal prediction performance. Unlike many other
metrics, AUC Gap works for any number of subgroups (e.g., intersectional gender-race groups, or multiple levels of SES and prior knowledge) and does not favor one prediction outcome over another (e.g., in other contexts, bias is associated with underpredicting a favorable outcome, such as release on bail or qualifying for a loan, for a disadvantaged group).
Formally, AUC gap is the largest disparity in predictive performance across a set of arbitrarily many (possibly-overlapping) subgroups G (e.g., gender identities, ethnicities, socio-economic status, prior GPA bands). AUC Gap can be calculated for any prediction model for which there is a known correct value, including ones that involve LLMs, so long as an AUC value can be derived: for multiclass prediction models, this can be achieved by predicting one vs. all other classes; for continuous (real number) predictions, this can be achieved by thresholding. AUC Gap is a simple indicator of the presence and level of bias in many types of models, but it does not pinpoint the source of bias like a measure that is specific to the representation of the feature set (e.g., tokens or sentence embeddings). We therefore recommend AUC Gap as an initial step to diagnose potential bias issues before using more tailored techniques to investigate the sources of bias (of course, the logic of AUC Gap, examining the maximum discrepancy in group-based performances, can be extended to any other measure of performance).
Figure 1. Example of visualizing the test AUC (left) alongside the subgroup test AUCs (center) and the AUC Gap (right) for four subgroups and two different models. While the subgroup AUCs (middle image) show the results for multiple groups at once (shown by triangles and squares which are filled in or not), it can be overwhelming when many combinations are compared. The AUC Gap (far right) provides a single statistic to capture this range.
Bias Mitigation Strategies
A number of strategies can be used to mitigate model bias. Which strategy is most appropriate and effective will depend on the particular use case, as this depends on the source of the bias, available resources, and technical expertise (drawing out this decision tree is outside the scope here). Mitigation strategies in machine learning, particularly for handling biases in AI models, can be categorized into pre-processing, in-processing, and post-processing approaches.Here we introduce commonly used strategies with a brief description of each to help guide the selection of bias mitigation strategies.
Pre-processing strategies focus on the data before it is fed into the model. This involves ensuring the data is representative, diverse, and unbiased often by applying techniques like reweighing or resampling to balance the dataset. For example, if a dataset has a gender imbalance, pre-processing might involve adding more examples from the underrepresented gender to create a more balanced dataset. We introduce a few commonly used techniques in the pre-processing stages:
Massaging generates weights for the training examples in each <group, label> combination differently to ensure fairness before classification
Synthetic Minority Over-sampling Technique(SMOTE) over/undersamples by creating or duplicating synthetic instances for the disadvantaged group or eliminating instances from the advantaged group
Learning Fair Representation (LFR) finds a latent representation to encode the data, minimizing the information loss of non-sensitive attributes, while eliminating information about sensitive attributes
Prejudice Free Representations (PFR) identifies and removes discriminating features by processing the dataset iteratively and eliminating information about the features that are relevant to the sensitive attributes
In-processing strategies are applied during model training, which is a more direct way to influence the trained model compared to pre-processing strategies. In-processing strategies are the most frequently used in the literature. They involve designing algorithms that are inherently less biased or have mechanisms to counteract bias. Regularization techniques, which prevent overfitting to biased data, and adversarial training, which explicitly models and then reduces bias, are common in-processing methods. For instance, a model might be trained with an additional component that penalizes it for making biased predictions. We introduce a few commonly used techniques in the in-processing stages:
Prejudice Remover reduces the statistical dependence between sensitive attributes and other features by adding a fairness term to the regularization parameter
Exponentiated gradient reduction generates a randomized classifier subject to desired constraints by iteratively tweaking a classification model subject to a constraint such as demographic parity or equalized odds (also see Grid Search Reduction)
Meta fair classifier differs from exponentiated gradient reduction in that it has the fairness constraint as an input into a meta-algorithm to simplify the problem of solving a family of linearly constrained optimization problems
Adversarial learning trains models that compete to improve performance, where one model tries to predict the true label without letting the other model exploit fairness issues
Post-processing strategies are applied after training to predicted labels. They tend to adjust the output of the model to counteract biases. They are rarely used in the literature, perhaps because most of these strategies would need to be repeated every time the model is used. For example, if an algorithm shows a bias against a certain group, post-processing might involve adjusting the thresholds for flagging students from that group to ensure fair representation. This strategy does not change the model itself but alters its outputs to be more equitable. We introduce a few commonly used techniques in the post-processing stages:
Gradient Feature Auditing (GFA) is an input correction method that modifies labels in the test data (similar to pre-processing), making it especially useful for auditing black box models
Calibrated Equalized Odds corrects the output by training one classifier for the advantaged group and one for the disadvantaged group, and then adjusting output probabilities with an equalized odds objective
Reject Option Based Classification (ROC) corrects the output by strategically modifying predicted labels where confidence is low to obtain fairer predictions
Randomized Threshold Optimizer (RTO) debiases predictions as a regularized optimization problem for sensitive features using a statistical parity metric
Bias Analysis and Mitigation Toolkits
There are several established toolkits and libraries to measure bias and apply bias mitigation strategies designed for engineers, developers, and researchers. We provide an overview of three major bias toolkits (see here for an in-depth review of their features).
IBM AIF 360 is a comprehensive toolkit designed to assess and mitigate biases in AI models. It has various features to identify biases across different stages of the ML lifecycle. The toolkit offers capabilities for data analysis to detect biases in datasets by examining distributions and patterns. It also provides model assessment tools to evaluate algorithmic fairness, enabling the identification of biases during model training and inference. As fairness metrics, it offers Statistical Parity, Disparate Impact, Equal Opportunity, Predictive Parity, Group Fairness Metrics, and Confusion Matrix Disparities. As mitigation strategies, it offers Reweighting, Rewriting Rules, and Adversarial Debiasing. An active Slack channel is available to get help.
FairLearn is an open-source Python library to support fairness in ML models. It provides a set of tools and algorithms that help analyze and mitigate bias in predictive models. It offers features to assess and compare model fairness across different groups. As fairness metrics, it offers for instance Demographic Parity, Equalized Odds, Equal Opportunity, Calibration, and Error Rate Balance. As mitigation strategies, it offers for instance Exponentiated Gradient Reduction, GridSearch, Threshold Optimizer, and Equalized Odds Postprocessing.
Google’s Fairness Indicator is a collection of tools that utilize TensorFlow Model Analysis (TFMA). TFMA is a library designed for evaluating a wide range of ML models, whether built on TensorFlow or other platforms. It enables the assessment of models using extensive datasets in a distributed manner, computing various metrics within the model structure and across different data segments. As fairness metrics, it offers for instance False Positive Rate Parity, False Negative Rate Parity, Positive Predictive Parity, Negative Predictive Parity, Statistical Parity Difference, and Mean Difference. These metrics can then be visualized in notebooks, facilitating comprehensive evaluation and visualization of model performance and fairness. As mitigation strategies, it offers for instance MinDiff and Counterfactual Logit Pairing. Fairness Indicator also provides tutorials and resources through Blog Posts and on Github.
Bias Measurement and Mitigation Demo
We demonstrate bias measurement and mitigation using the Fairlearn library with an open dataset released for the NeurlPS 2020 Education Challenge sponsored by Eedi. We adapt the first competition task of predicting if a given student will answer a given question correctly (a binary classification problem). The data contains IDs for every question and student, and student’s self-reported gender (male, female, other, unspecified). Questions and students in the test set are all observed in the training data. We construct three simple features for this demonstration:
1. the question difficulty approximated by the average proportion of incorrect responses to that question in the training data
2. the student ability, approximated by the average proportion of correct responses by that student in the training data
3. a gender-dependent noisy proxy for the outcome to induce bias, generated as a binary coinflip, except for 80% of observations for female students where the value is set to the correct outcome (this creates a feature that has predictive power for female students but not other students)
We train a logistic regression classifier and compute the AUC overall and for each gender-based subgroup in the test set provided as part of the competition packet. This yields the necessary information to measure the AUC Gap. Table 1 shows the AUC scores without mitigation and an AUC Gap of 0.164 between the “Female” (0.781) and “Other” (0.617) groups.
To mitigate the observed bias, we use a popular in-processing mitigation strategy called exponentiated gradient reduction (EGR) via the Fairlearn library. In short, this method repeatedly tweaks the model until it makes fairer decisions with respect to gender while attempting to maintain accuracy. The method depends on specifying a fairness measure to optimize for and we compare two different measures in Table 1: True Positive Rate Parity and Equalized Odds. We find that mitigation by EGR with either constraint effectively reduced bias: the AUC Gap is close to zero. However, the overall model performance was also reduced in the process, which shows a trade-off between model fairness and overall performance: forcing the model to reduce group disparities made it a less accurate model compared overall. We hope this simple demonstration encourages engineers to try out bias measurement and mitigation in their own applications.
Table 1. Demonstration of bias measurement with AUC Gap and various mitigation strategies using data from the NeurlPS 2020 Education Challenge and the Fairlearn library.
| Group | Number of students | Number of questions answered |
Test AUC without mitigation |
Test AUC Mitigation by EGR with True Positive Rate Parity |
Test AUC Mitigation by EGR with Equalized Odds |
|---|---|---|---|---|---|
| All | 118,971 | 17,851,332 | 0.702 | 0.587 | 0.537 |
| Female | 46,911 | 7,114,588 | 0.781 | 0.603 | 0.533 |
| Male | 44,039 | 6,632,832 | 0.653 | 0.581 | 0.542 |
| Other | 28,001 | 4,100,826 | 0.640 | 0.566 | 0.536 |
| Unspecified | 28,001 | 4,100,826 | 0.640 | 0.566 | 0.536 |
| AUC Gap: | 0.164 | 0.052 | 0.003 |